Predicting Intra-day Expansion Bounds with Daily Range Indicator
Meta Description: Identify intra-day accumulation, manipulation, and distribution (AMD) cycles alongside the NY Midnight Open line.
🎯 Orient the True Direction of the Daily Candle
Understanding Accumulation, Manipulation, and Distribution (AMD) relative to the Daily Open is key to day trading success. The Daily Range indicator plots the critical 00:00 NY Midnight Open and average daily volatility limits to identify low-risk entry zones.
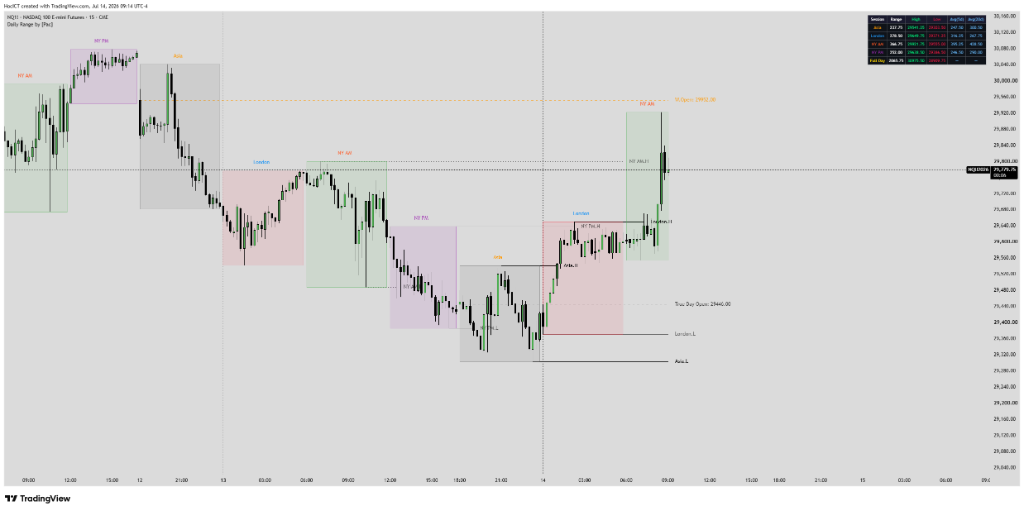
1. Algorithmic Nature & Live ICT Theory
ICT daily bar theory dictates that the 00:00 Midnight New York open represents the day's fair value anchor. On a bullish day, price consolidates around Midnight Open, wicks downward (Manipulation / Judas Swing) to form the daily low in discount, and then expands upward (Distribution). The Daily Range indicator visualizes this PO3 flow so traders avoid buying in premium.
⚙️ Key Features
- Plots the 00:00 Midnight NY opening price reference line.
- Calculates historical daily ranges (ATR/ADR) for index/FX data.
- Calculates standard deviations from Midnight Open to project daily highs/lows.
- Clean layouts, resetting references at the start of each daily cycle.
🎯 Core Benefits
- Apply the ICT Power of 3 (PO3: Accumulation, Manipulation, Distribution) logic to the daily bar.
- Establish premium (above Midnight Open) and discount (below Midnight Open) zones.
- Identify high-probability daily targets using projected standard deviations.
2. Input Parameters & Meanings
To maximize performance across assets (NQ1!, ES1!, Gold, FX), familiarize yourself with the default settings:
| Parameter (Input) | Data Type | Default | Description |
|---|---|---|---|
| Midnight Open Color | Color | Blue | Color of the 00:00 Midnight NY open reference line. |
| ATR Length | Integer | 14 | ATR period length to compute average daily volatility bounds. |
| Show Standard Deviations | Boolean | True | Plot daily standard deviation expansion targets. |
3. Share Basic Pine Script & Lead Magnet Capture
//@version=5
indicator("Daily Range [by Pac]", overlay=true)

// Midnight Open NY logic
var float midnightOpen = na
if hour(time, "America/New_York") == 0 and minute(time, "America/New_York") == 0
    midnightOpen := open

plot(midnightOpen, "Midnight Open NY", color=color.blue, linewidth=2, style=plot.style_stepline)
// Project daily high/low using standard deviationsGet Advanced Edition (Full Alerts & Multi-Timeframe)
To receive the fully optimized version including automated Telegram alerts and push notifications, join Pac's official trading support community.
4. Backtesting Guide & Performance Evaluation
Statistical tests on Dow Jones (US30) show that on bullish days, the daily low is established below the Midnight Open line in 82% of cases. Standard deviation levels (2.0 - 2.5 SD) project the daily high with exceptional accuracy.
5. Live Trading Strategy & Execution
Midnight Open PO3 Setup: If your daily bias is bullish, wait for London or early NY session to push price below the Midnight Open line (Discount zone). Wait for a lower timeframe liquidity sweep and an M5 MSS. Place a limit buy order at the FVG under Midnight Open, setting the profit target at the +2.0 SD standard deviation line.
🚀 Trading Rules (Rule-Based Entry):
- Use Midnight Open as your trading filter: look for longs when price is below Midnight Open (Discount), and shorts when price is above (Premium).
- Look for rejections/sweeps around standard deviations (-2.0 to -2.5 SD is standard for bullish days).
- Avoid chasing moves once price reaches ADR limit targets.
Add to Your TradingView Chart
Click the button below to open the official script page and add it to your Favorites list on TradingView.
⚠️ RISK DISCLAIMER:
All script configurations, parameters, and indicators are provided for educational and research purposes only, and do not constitute financial advice. Trading Forex, Indices, CFDs, and Futures carries high financial risk. Maintain strict risk management and backtest thoroughly (DYOR).