Mastering Weekly & Daily Opening Gaps with ICT NWOG & NDOG Indicator
Meta Description: Master daily and weekly opening gaps on TradingView. Learn the IPDA algorithm liquidity-delivery concepts for SMC/ICT strategy.
🎯 Lock in the Smart Money Liquidity Gaps
Opening gaps (NWOG & NDOG) are the exact structural footprints where the IPDA algorithm seeks to re-deliver liquidity before expanding the trend. Failing to track these high-timeframe gaps often leads retail traders to enter during premature false breakouts. This indicator automates drawing and updating these levels so you can focus strictly on identifying low-risk setups.
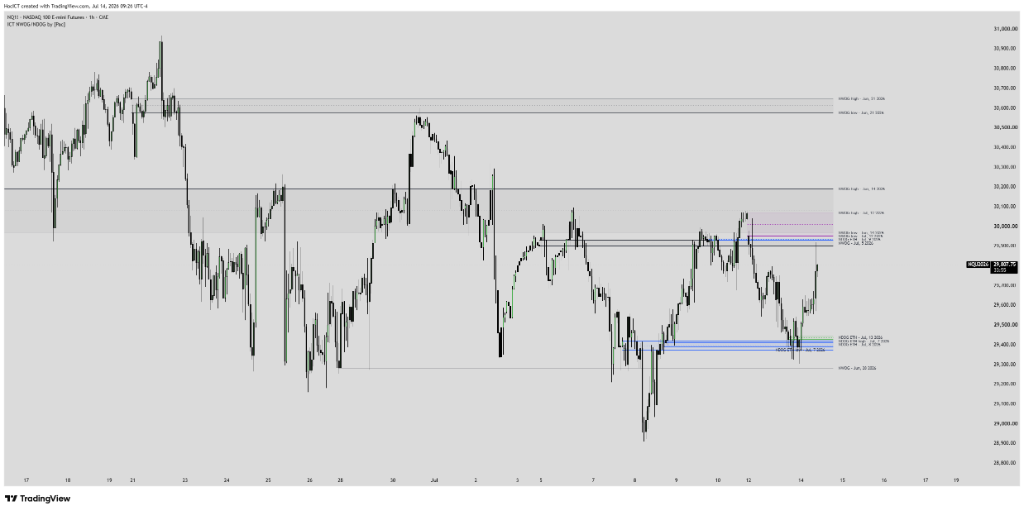
1. Algorithmic Nature & Live ICT Theory
In the ICT trading methodology, time and opening prices act as key algorithmic anchors. The New Daily Opening Gap (NDOG) and New Weekly Opening Gap (NWOG) represent the market's initial liquidity voids. As the IPDA algorithm seeks equilibrium, it naturally draws price back to retest these gaps to fill institutional orders before establishing a true daily trend expansion.
⚙️ Key Features
- Automatically plots the New Daily Opening Gap (NDOG).
- Automatically plots the New Weekly Opening Gap (NWOG).
- Allows turning on/off each gap line individually.
- Customizable colors, width, and styles to avoid chart clutter.
🎯 Core Benefits
- Identify high-probability Liquidity Voids caused by market spread dilation at session opens.
- Track price pullbacks, as price naturally draws toward these gaps (Draw on Liquidity).
- Establish key algorithmic support/resistance levels for optimal execution.
2. Input Parameters & Meanings
To maximize performance across assets (NQ1!, ES1!, Gold, FX), familiarize yourself with the default settings:
| Parameter (Input) | Data Type | Default | Description |
|---|---|---|---|
| Show Daily Gaps (NDOG) | Boolean | True | Toggle the display of the daily gap. |
| Show Weekly Gaps (NWOG) | Boolean | True | Toggle the display of the weekly gap. |
| NDOG Line Color | Color | Orange | Line color used to draw NDOG lines. |
| NWOG Line Style | Style | Dashed | Define line style (Dashed or Solid) for the weekly gap. |
3. Share Basic Pine Script & Lead Magnet Capture
//@version=5
indicator("ICT NWOG & NDOG [by Pac]", overlay=true)

// Inputs
showNDOG = input.bool(true, "Show Daily Gaps (NDOG)")
showNWOG = input.bool(true, "Show Weekly Gaps (NWOG)")

// Logics for Daily Gap (Example)
var float dailyClose = na
var float dailyOpen = na

if ta.change(time("D"))
    dailyClose := close[1]
    dailyOpen := open

plot(showNDOG ? dailyClose : na, "NDOG Close Line", color=color.orange, style=plot.style_linebr)
plot(showNDOG ? dailyOpen : na, "NDOG Open Line", color=color.orange, style=plot.style_linebr)Get Advanced Edition (Full Alerts & Multi-Timeframe)
To receive the fully optimized version including automated Telegram alerts and push notifications, join Pac's official trading support community.
4. Backtesting Guide & Performance Evaluation
This indicator is highly effective on lower timeframes (M1, M5) for precise execution entries. Backtesting over the past 50 sessions on NASDAQ (NQ1!) or S&P 500 (ES1!) futures reveals that over 70% of NDOG opening gaps are partially or fully filled during the New York Morning (AM) Session.
5. Live Trading Strategy & Execution
NDOG Confluence Setup: Wait for the daily session open and locate the NDOG lines. If the daily bias is bullish, wait for price to retest the NDOG lines below the Midnight Open price (Discount zone). Once price tests the NDOG and shows a quick wick rejection conjoined with an M1 Market Structure Shift (MSS), enter a long position at the newly formed FVG, placing the stop loss below the swing low and targeting the Asian session high.
🚀 Trading Rules (Rule-Based Entry):
- Monitor price reactions on lower timeframes (M1/M5) as price approaches the NDOG/NWOG boundary lines.
- If a clear rejection candle or a Market Structure Shift (MSS) forms, look for entries targeting opposite liquidity pools.
- Avoid initiating trades at these levels once the gaps have been fully filled (mitigated).
Add to Your TradingView Chart
Click the button below to open the official script page and add it to your Favorites list on TradingView.
⚠️ RISK DISCLAIMER:
All script configurations, parameters, and indicators are provided for educational and research purposes only, and do not constitute financial advice. Trading Forex, Indices, CFDs, and Futures carries high financial risk. Maintain strict risk management and backtest thoroughly (DYOR).