Unlocking the 90-Minute Quarter Cycles with QT Cycles Indicator
Meta Description: Divide your trading sessions into 90-minute blocks to analyze algorithm distribution cycles on TradingView.
🎯 Decode Market Intent Quarter by Quarter
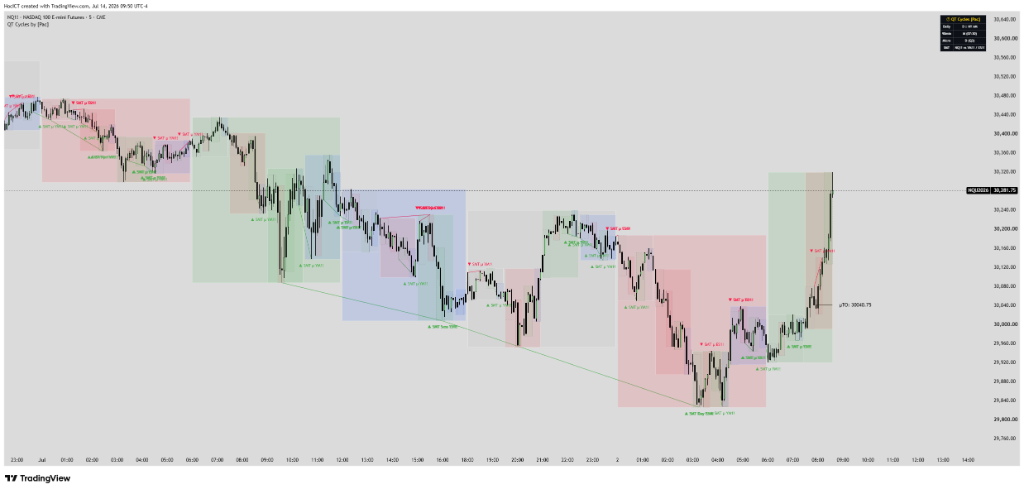
The IPDA algorithm divides trading sessions into highly structured 90-minute cycle blocks (Quarters). The QT Cycles indicator visualizes these phases, allowing you to align your strategy with accumulation, manipulation, distribution, and reversal windows.
1. Algorithmic Nature & Live ICT Theory
Quarterly Theory divides time into cyclical quadrants starting at Midnight. Applied to intraday charts, each 90-minute block acts as a micro order-flow cycle: Q1 consolidates orders, Q2 acts as the Judas Swing manipulation to trap late breakouts, Q3 serves as the primary distribution trend, and Q4 wraps up delivery or retraces. Mastering this quadrant logic ensures you trade strictly with the trend.
⚙️ Key Features
- Divives the trading day into 90-minute cycles starting at 17:00 NY time.
- Highlights each of the 4 Quarters (Q1, Q2, Q3, Q4) using different background colors.
- Eliminates broker-specific timezone offsets and candle discrepancies.
- Clean layouts, helping traders easily visualize quarterly transitions.
🎯 Core Benefits
- Track intraday cycles: Accumulation (Q1) -> Manipulation (Q2) -> Distribution (Q3) -> Reversal/Expansion (Q4).
- Identify the exact timing of Judas Swing manipulations (typically Q2).
- Optimize entries to target high momentum expansion trends in Q3.
2. Input Parameters & Meanings
To maximize performance across assets (NQ1!, ES1!, Gold, FX), familiarize yourself with the default settings:
| Parameter (Input) | Data Type | Default | Description |
|---|---|---|---|
| 90-Min Grid Lines | Boolean | True | Display vertical separator grids at 90-minute blocks. |
| Background Color Opacity | Integer | 95 | Background color opacity of the 4 Quarters. |
| Show Session Names | Boolean | True | Display session labels at cycle boundaries. |
3. Share Basic Pine Script & Lead Magnet Capture
Get Advanced Edition (Full Alerts & Multi-Timeframe)
To receive the fully optimized version including automated Telegram alerts and push notifications, join Pac's official trading support community.
4. Backtesting Guide & Performance Evaluation
Backtesting on GBPUSD shows that trades initiated in Quarter 3 (after Quarter 2 wicks past the high/low of Quarter 1) yield a 72% success rate in reaching a 2.5R target during active London sessions (02:00 - 05:00 AM NY).
5. Live Trading Strategy & Execution
Quarterly 90-min Strategy: Mark the highs/lows of Q1 (the first 22.5 mins). Watch for price to sweep past the Q1 bounds during Q2. Once price wicks back and closes inside as Q3 begins, enter a market order (or limit at the M1 FVG) in the opposite direction of the Q2 sweep. Place the stop below the Q2 low and target the Q1 opposite bound.
🚀 Trading Rules (Rule-Based Entry):
- Check the colored background grids to identify the current Quarter.
- Avoid trading in Q1 (Accumulation); simply mark key range bounds.
- Wait for a stop hunt in Q2 (Manipulation). Once Q3 (Distribution) starts, execute in the direction opposite to the Q2 sweep to ride the main session drive.
Add to Your TradingView Chart
Click the button below to open the official script page and add it to your Favorites list on TradingView.
⚠️ RISK DISCLAIMER:
All script configurations, parameters, and indicators are provided for educational and research purposes only, and do not constitute financial advice. Trading Forex, Indices, CFDs, and Futures carries high financial risk. Maintain strict risk management and backtest thoroughly (DYOR).